Imagine being able to test your football trading strategy ideas on more than 302,000 historical football matches.
Our Team Stats Database has a record of every match played over the past 10+ years in 80 leagues worldwide and hundreds more are added each and every week.
We're not just talking goals and results though... our football database has virtually played each game through every season in order to record a huge number of pre-match stats. This allows you to research your own detailed system ideas within seconds.
We have designed the Database so that it's very easy for everyone to use. You don't need to know anything about database queries or Excel formulae, we handle all of that in the background so you get access to all the information you need with minimum effort.
You can even export your results to a PDF file or save the query and come back to it later on.
As if that wasn't enough, we've also integrated the Database with our Custom Filter and Live Stats Module tools.
Let's take it for a spin!
Introduction to the Team Stats Database
The Team Stats Database allows you to see how football results are impacted by very specific filters and conditions.
For example, I can ask the Database to only show me results of matches when the home team was in the top third of the league table. I have also excluded the first five games of each season for each team which reduces the total number of 230,064 results to 187,572.
Within seconds, the Database has crunched though the 187,572 results and determined that 55,765 featured a home team in the top third of the league table.
It also shows me that just this one condition results in 11% more home wins than the average of all games.
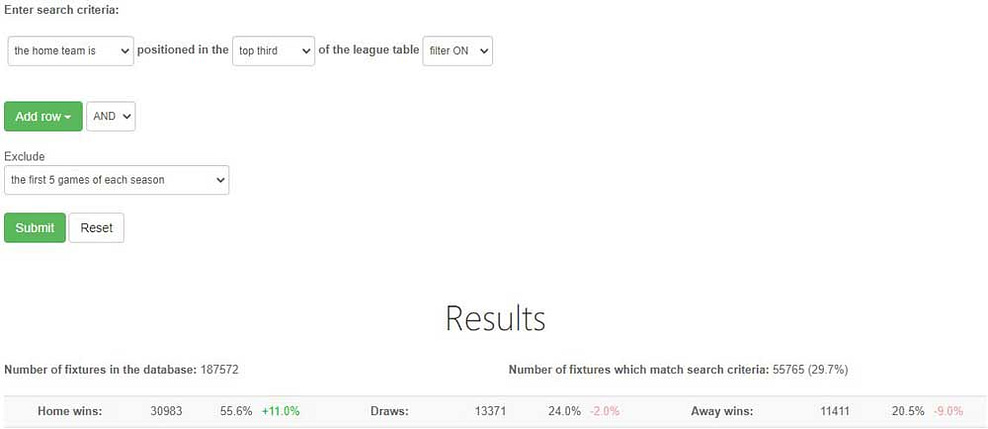
Now... that's just the top row of the full report because it's too big to screenshot. It actually looks like this!
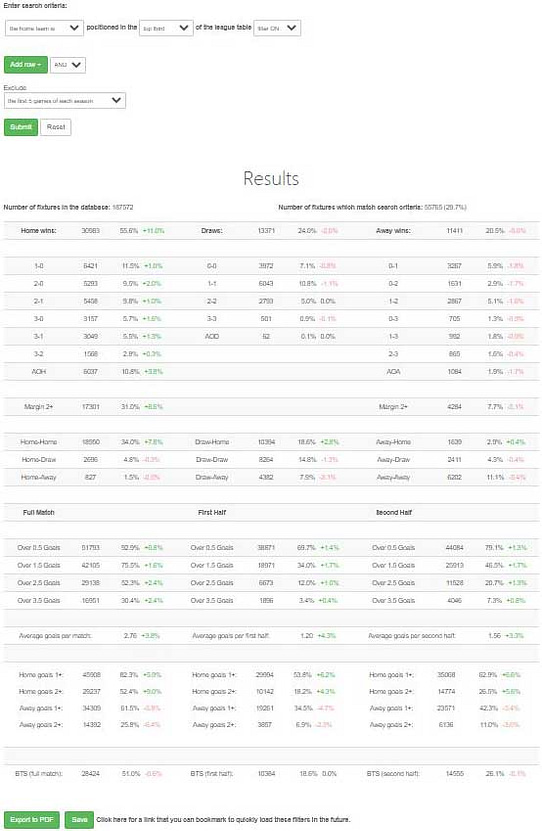
It's an incredible amount of detail which covers correct scores, double result, overs/unders, average goals, both teams to score and more.
You probably can't see much of the detail, but the Database also offers the option to export results to a PDF file. I have uploaded it so you can take a good look through all the results.
Ok... so let's add some more conditions.
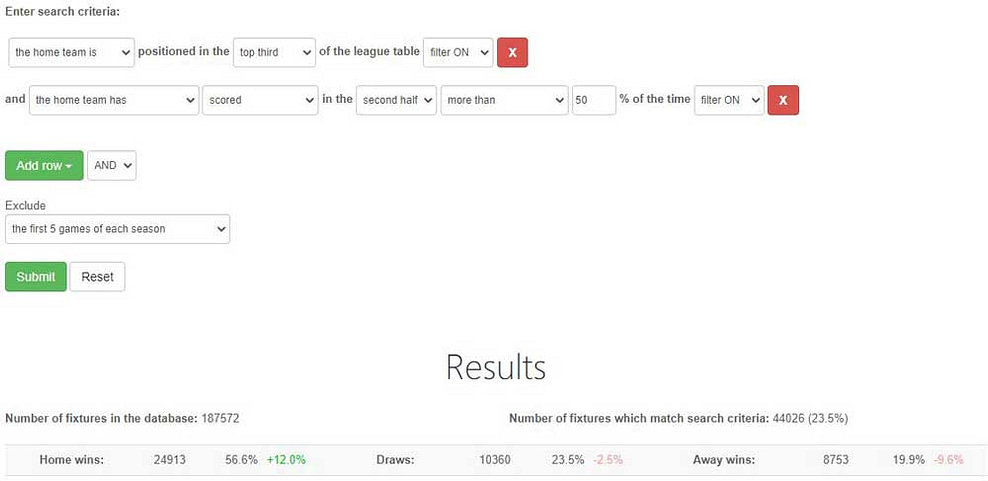
If I specify that the home team must have scored in the second half in at least 50% of their home games, the percentage of home wins increases to 12% above the average.
You can see, however, that these figures are now based on 44,026 games and the more filters I add, the lower that number will go.
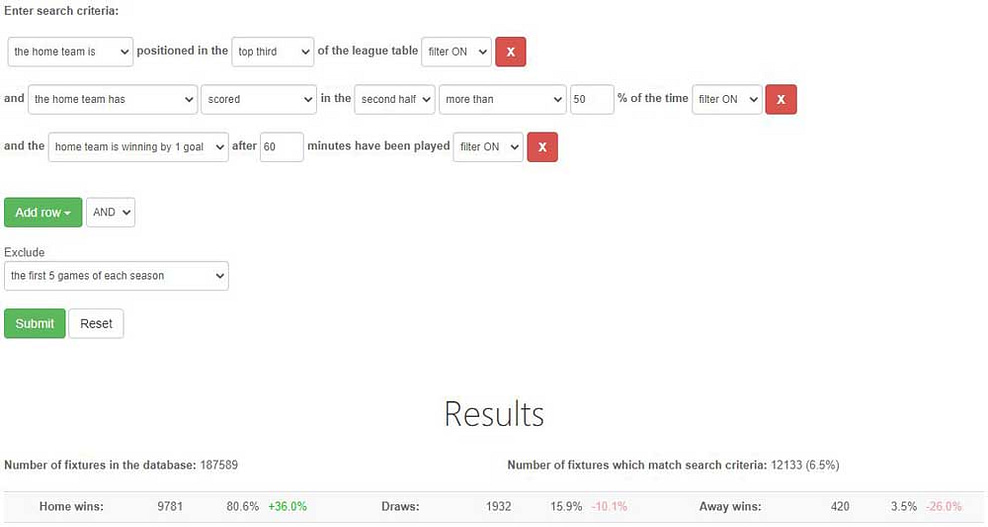
If I also state that the home team must be winning by one goal after 60 minutes have been played, the percentage of home wins rises substantially. No surprise there.
What about if the score is level?
As expected, the percentage of home wins drops because time is running out.
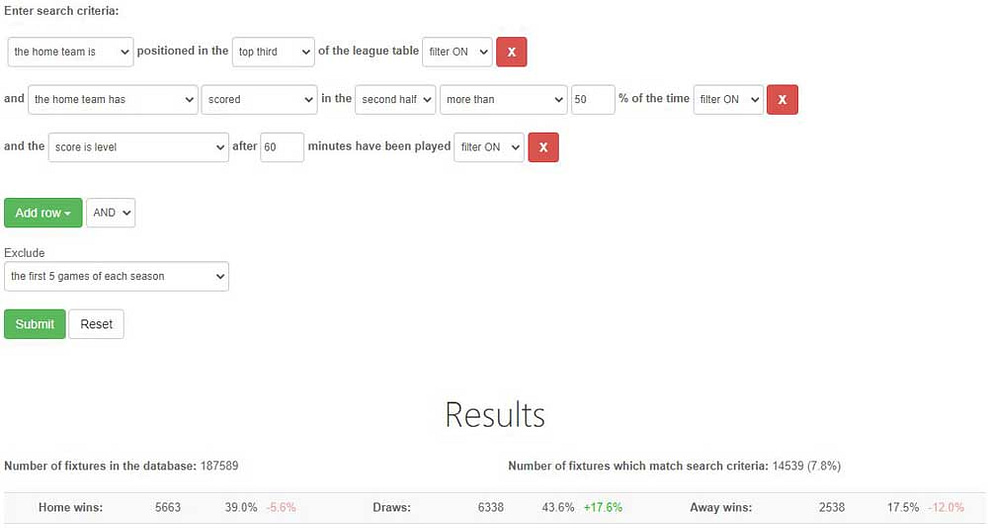
But if I give the home team a helping hand by stating that the away team must be in the bottom third of the league table, the percentage of home wins climbs back above the average for all games.
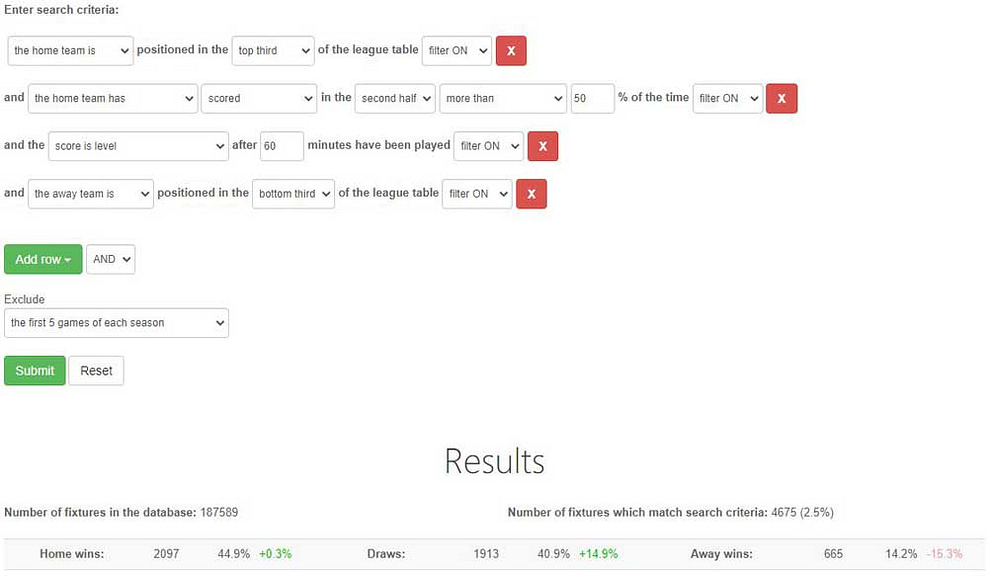
That explains why lay the draw traders have to wait so long for the draw price to drop when top third teams are playing at home.
You'll notice above that by adding all these filters, I have cut the number of matching games right down to 4,675. You do need to bear that in mind as fewer results mean less reliable stats.
I've shown you a few simple examples of conditions that can be applied to our football results database but there are many more. In fact, there are thousands of possible combinations to investigate!
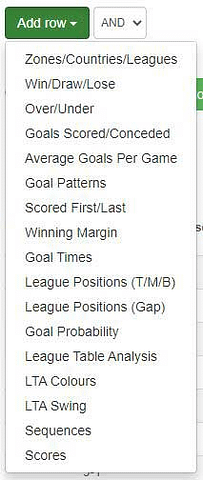
You could search only German games, or German Bundesliga games, or 'European A' which are the biggest European leagues. You can look at teams which have won a certain number of games in a row, or lost a couple, or which have been scoring early goals - or not.
It's completely flexible and you can go into a huge amount of detail.
Another great thing is that the conditions match our Custom Filter tool. Once you have found a set of filters you're interested in, you can put them into Team Stats and it will build you a list of qualifying fixtures for up to a week ahead. Perfect for live testing!
We haven't stopped there either. Our Live Stats Module calculates projections of home win, draw and away win as well as over and under 2.5 goals based on Team Stats Database data. It recalculates these projections every minute in-play to take account of the score and time played.
Projections have proven especially useful as a reality check.
For example, when an elite team is a goal down at home, inexperienced traders are keen to 'lump on' but the projection shows just how often the teams really do come back to win. The market prices are always pretty terrible and it certainly makes everyone think twice!
Our football statistics database is a fantastic system research tool as well a useful reference for in-play situations. It is easy enough for beginners to use, with more than enough detail to keep professional football traders happy,

