Traders need access to the right football stats, presented in the best way for quick and easy research.
When I first started trading football, I tried lots of stats sites. However, I quickly found that they didn't have all the stats I needed and they were plastered with annoying bookie ads.
It was frustrating, but made sense. After all, those sites are built by marketing people rather than traders so they have no idea what they're doing.
They make money from bookies, who pay out a percentage of your losses in commissions. Therefore, these stats site operators prefer that you lose money so that they get paid!
My solution at the time was to keep my own spreadsheets of stats. I was able to keep up with 20 leagues, but it meant 20+ hours each week updating and checking stats before I could even start any research. I couldn't keep doing that!
In 2013, I started the development of Team Stats. My aim was to build the best football stats website for traders, in the perfect format for quick and easy research.
It had to include everything that a trader needs, without the useless stuff that so many other sites think are somehow relevant.
Fast forward to today and Team Stats is the industry leader, by far.
Introduction to Team Stats
At the time of writing, Team Stats covers 85 leagues worldwide.
I could add another 200 leagues if I wanted, but what would be the point? These are the 85 leagues which have the best liquidity on Betfair, so they're what football traders concentrate on.
Remember, the aim of Team Stats is to provide relevant football data for traders, nothing else.
Team Stats in Action
Team Stats is browser-based so there's nothing to download, install or update and it works perfectly on any device.
When you first load Team Stats, you can choose to view fixtures today, tomorrow or any day up to a week ahead. You can also choose current season stats, or the last 5, 10 or 15 games worth of data.
This is most useful at the start of a season. As long as both teams were in the same league, Team Stats uses previous season data to complete the 5, 10 or 15 games.
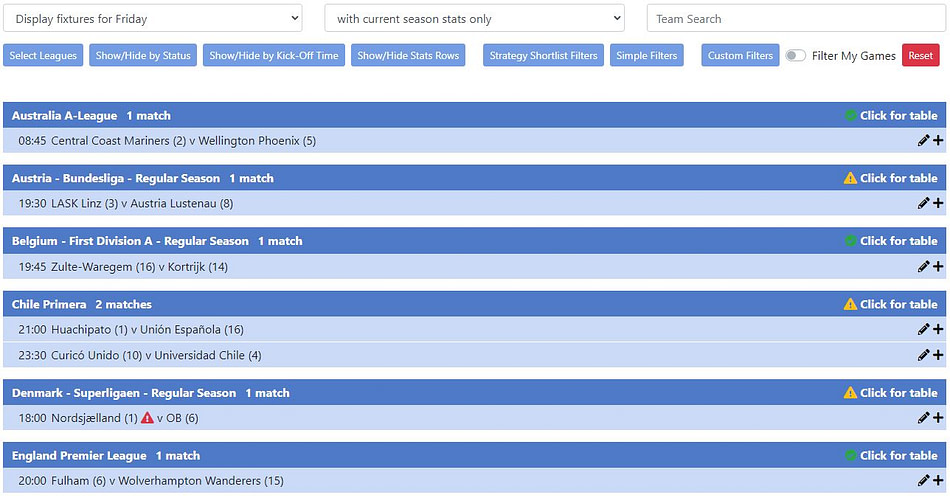
Next, there are seven blue buttons which are used for filtering.
We have six League Zones; European A, European B, European C, European Summer, Americas and Africa/Asia/Middle East.
The 'European A' zone contains the biggest European leagues which play during the winter; English Premier League, French Ligue 1, German Bundesliga, Italian Serie A, Dutch Eredivisie and Spanish Primera. 'European B' is medium sized leagues, then 'European C' is smaller leagues.
'European Summer' contains leagues such as the Icelandic Urvalsdeild, Norwegian Eliteserien, Republic of Ireland Premier Division and Swedish Allsvenskan, then 'Americas' and 'Africa/Asia/Middle East' covers the rest of the world.
Show/Hide by Status allows you to filter out leagues which have just started (0-10% and 11-20%) as well as leagues which are coming to a close (81-90% and 91-99%). You can also choose to hide teams that have a new Head Coach.
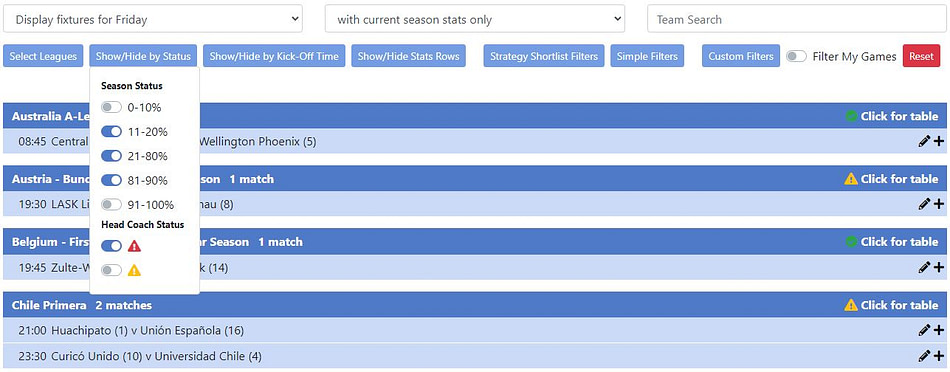
Team Stats alerts you to when there has been a managerial change. Teams often change their Head Coach after a poor run of results, so it's important that we know when to expect a change in form and trade cautiously.

You can filter fixtures by Kick-Off Time. This is really useful because if you're available to trade between 7.30pm and 10.30pm you don't need to see any of the afternoon action.
Immediately, you're left with a much better list of fixtures to start your research with.
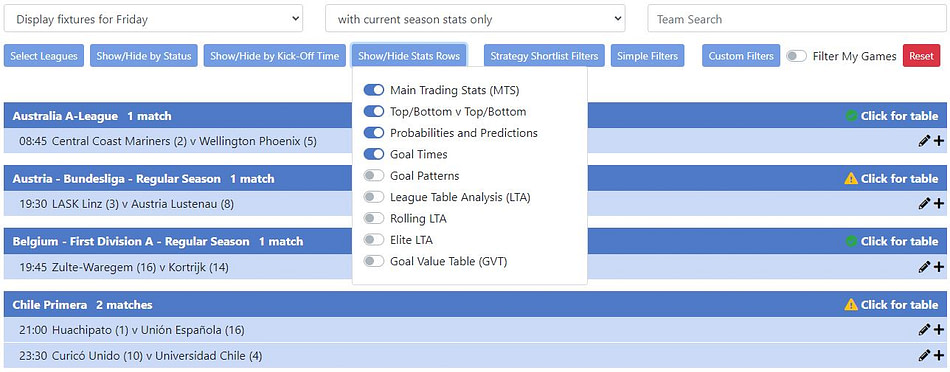
The fourth button along allows you to show/hide Stats Rows. There are nine rows of stats in total, but not every trader will want to see them all so you can hide the rows you're not interested in.
Again... the aim of Team Stats is to display relevant information, nothing else!
Once you've set your basic filters, click on a fixture row to view the stats for that fixture. Alternatively, click on a league to open up all fixtures in that league for the day.
This is an Australian A League fixture between Central Coast Mariners and Wellington Phoenix:
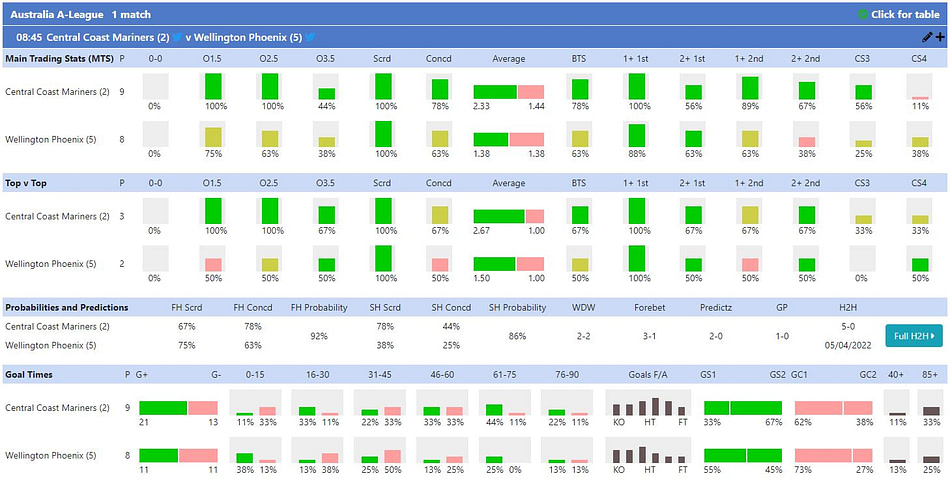
The top row shows what we call Main Trading Stats. It includes goals scored, goals conceded, overs/unders, both teams to score (BTTS) and more.
For this fixture, the second row is labelled Top v Top because both teams are in the top half of the A League. The stats are the same as the MTS row, except that they're calculated from Central Coast Mariners' home games against top half teams and Wellington Phoenix's away games against top half teams. Context is important!
Probabilities and Predictions is exactly that. There are probabilities for first and second half goals based on previous performance, score predictions and the head-to-head (H2H) record between the teams.
The bottom row in this example is Goal Times. Here, Team Stats shows you exactly when goals have been scored and conceded by these teams through the season so far.
That's just the first four rows of stats, we also have Goal Patterns, League Table Analysis (LTA), Rolling LTA, Elite LTA and Goal Value Table (GVT). Everything that any football trader needs is fully customisable.
If you want to see stats in more context, click on any team name and a score table will pop up:
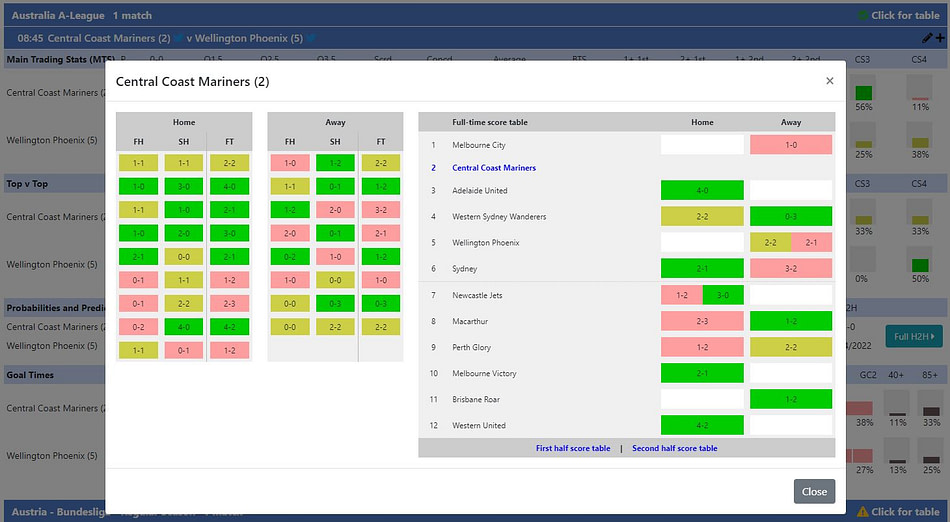
The score table shows you recent form on the left, then a league table on the right with scores for the season so far. At a glance, you can see exactly how teams have performed against similar strength opposition.
You can even switch the table to first half or second half to drill down further.
Team Stats contains a huge amount of information in the perfect format for football traders... and it gets better yet!
Custom Filters
Custom Filters are where the power of Team Stats really comes into its own.
When you click on Create Custom Filters you're given the opportunity to have a converation with Team Stats. You can literally form sentences and tell Team Stats exactly what you want to see.
For example, I have asked Team Stats here to show me any fixtures in which the home team has won more than half their home games and in which the away team has conceded a goal in the second half of more than half their away games.
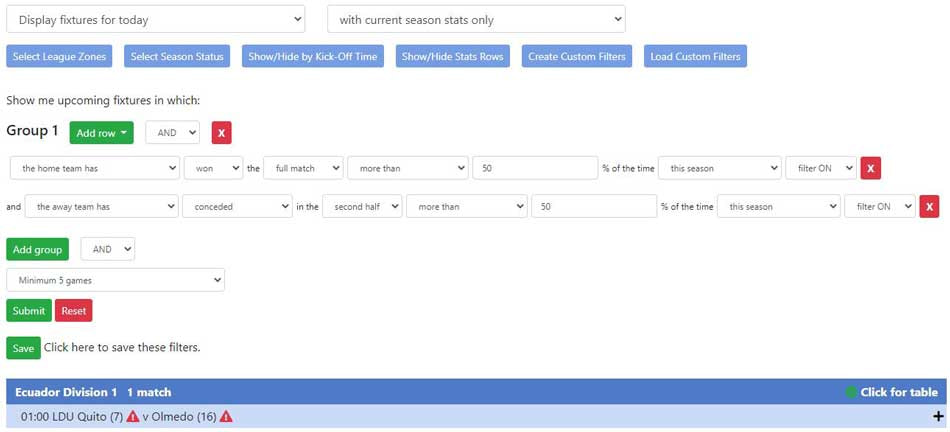
This simple filter pulled up a fixture in Ecuador which finished 4-0, with 3 of the goals scored in the second half.

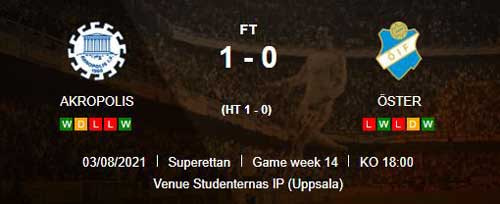
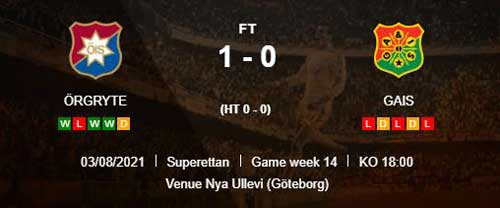
Here's another simple filter on the same day. This time, I asked Team Stats to show me fixtures in which both teams had not had a first half goal and in which both teams had gone under 2.5 goals in more than half their games.
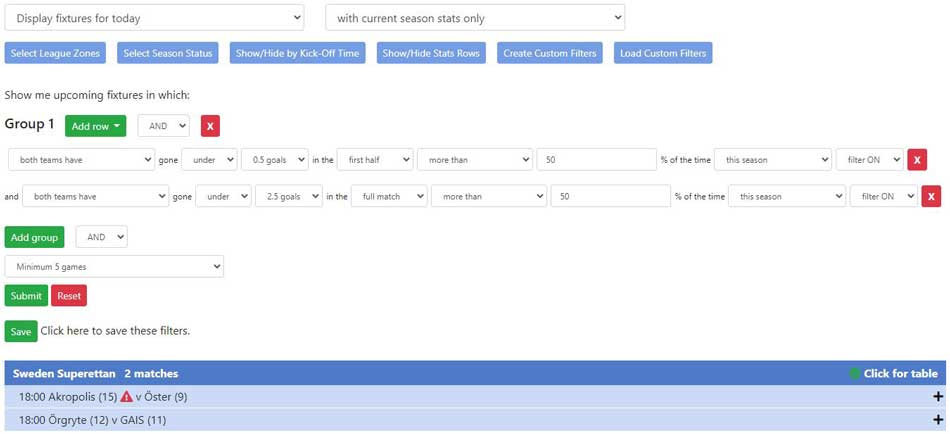
Two Swedish fixtures qualified, one was 0-0 at half-time and both finished 1-0. Perfect for time decay or unders traders.
There are hundreds of possible filter options which cover goals scored, goals conceded, overs/unders, both teams to score, goal patterns, winning margin, league positions, sequences, attacking strength and many more.
You can create complicated sets of filters, even groups of filters with AND/OR operators.
Once you're happy with a shortlist, click Save and you'll be able to load it again each day. You can even save a shortlist as a URL and create a button on your browser. Once click and a big chunk of your trade research is already done!
Compare Teams
The 'Compare Teams' feature is particularly useful for cup games in bigger competitions, such as Champions League or Copa Sudamerica. It's not going to help in the FA Cup third round when Manchester City are playing Lincoln City!
Say Millonarios of Colombia are playing Flamengo from Brazil, you can pull up their league stats to get an idea of how they might match up if they were in the same league.
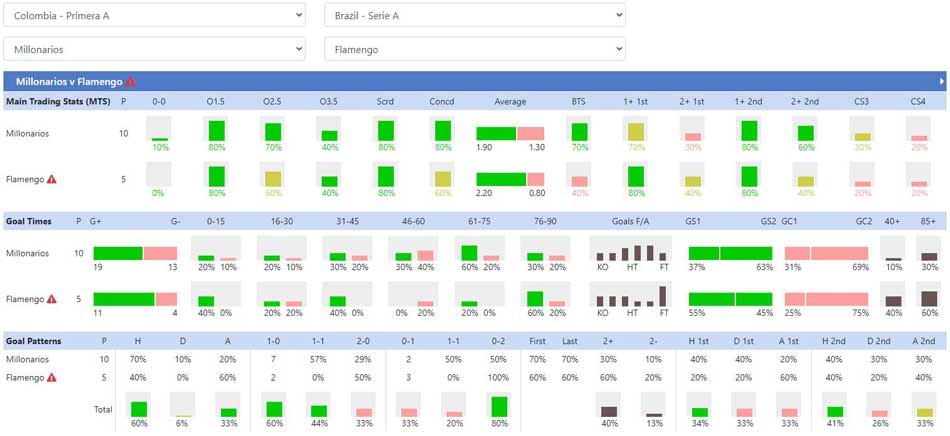
Of course, you do have to be careful with cup competitions as teams often line up differently, especially over two legs.
Team Stats Trends
As well as looking at individual teams, it's also important to know the characteristics of each league. Among other things, this will have a big impact on market prices.
The table below shows European Summer leagues sorted by average goals per game:
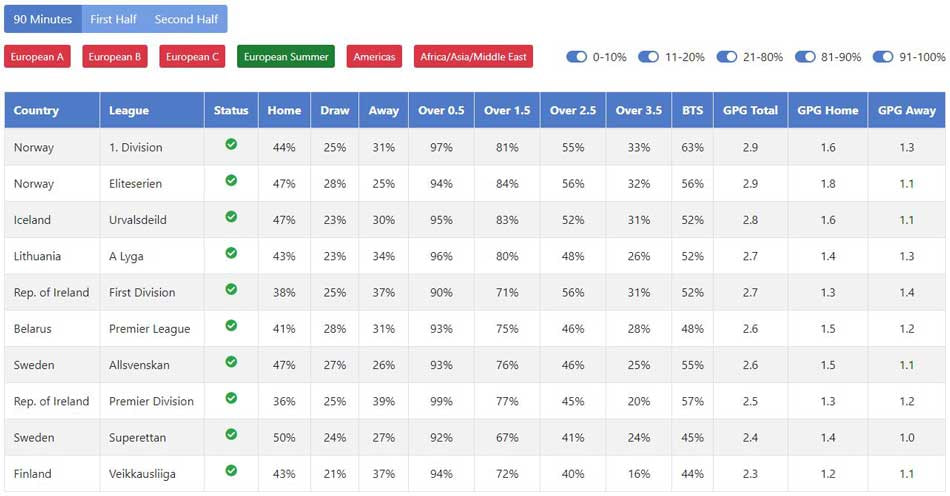
It gives you an instant snapshot of how each league is performing during the current season.
Of course, you do need context so Team Stats Trends also contains data for the past 10 years, as below:
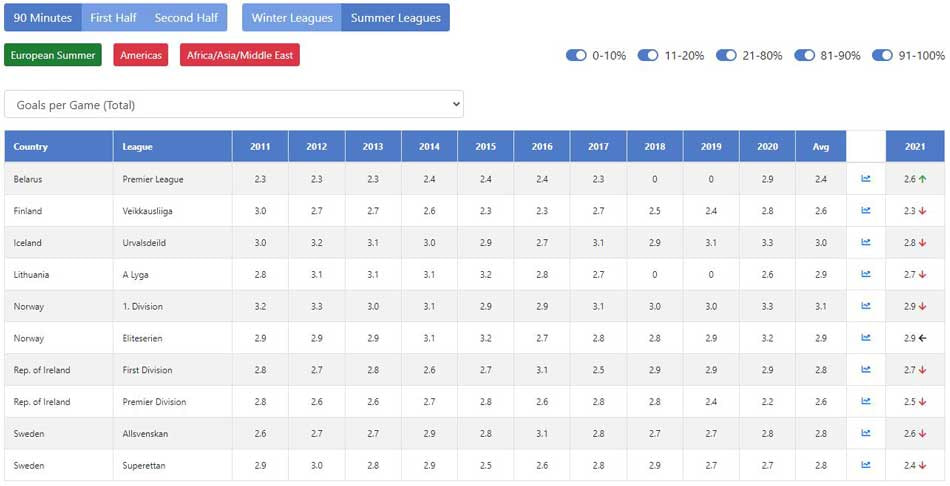
This is interesting! Right away, you can see that during the summer of 2021, almost all leagues had fewer goals per game than the average of the previous ten seasons.
The Belarusian Premier League was up and the Norwegian Eliteserien was bang on average, but the other eight European summer leagues were down on goals.
When you're trading goals, this is vital information to have at your fingertips.
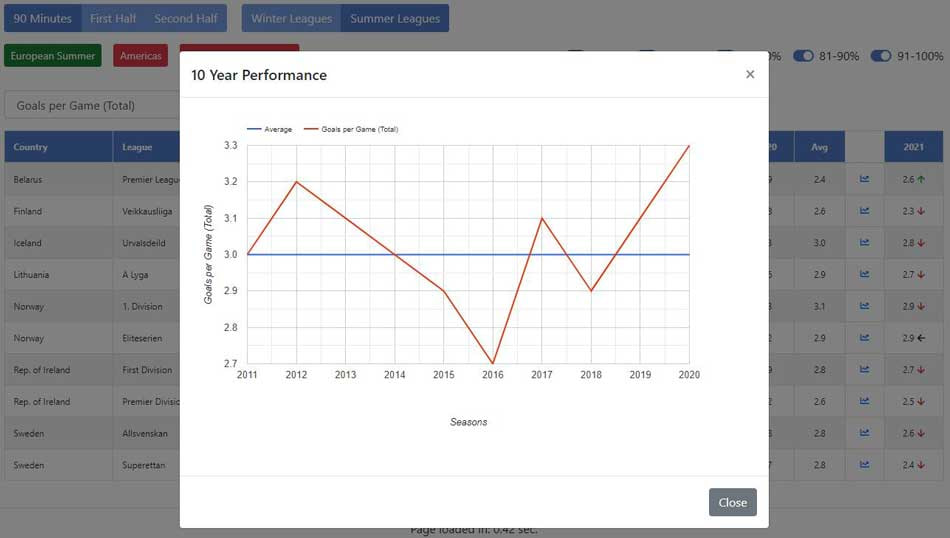
Team Stats Trends also plots all the figures on a graph which compares each league to the average. The Icelandic Urvalsdeild was way above average for goals during 2020, so perhaps it was due a quieter summer in 2021.
For football traders and even bettors, Team Stats is far better than any other football stats website. It cuts the time you spend on trade research massively, leaving you more time to trade football and then enjoy your life away from the screen.
You don't need to know anything about different leagues and teams around the world because Team Stats gives you instant knowledge. You can expertly trade teams you've never heard of before, very quickly and easily.